Gene Networks
Explore interactivity between genes of interest with the networks visualization.
General Description
Our network visualization aims to map interactions between genes of interest and other genes available within our Champions derived data, public datasets, and your uploaded data. It allows users to build protein-protein interaction maps which leverage data from the Pathway Commons database. Interactome maps can be overlaid with gene expression, protein expression or kinase activity for Champions PDX models. This tool also visualizes phospho-proteomic data from Champions’ PDX models or the public CPTAC database.
Network Inputs
Network Inputs:
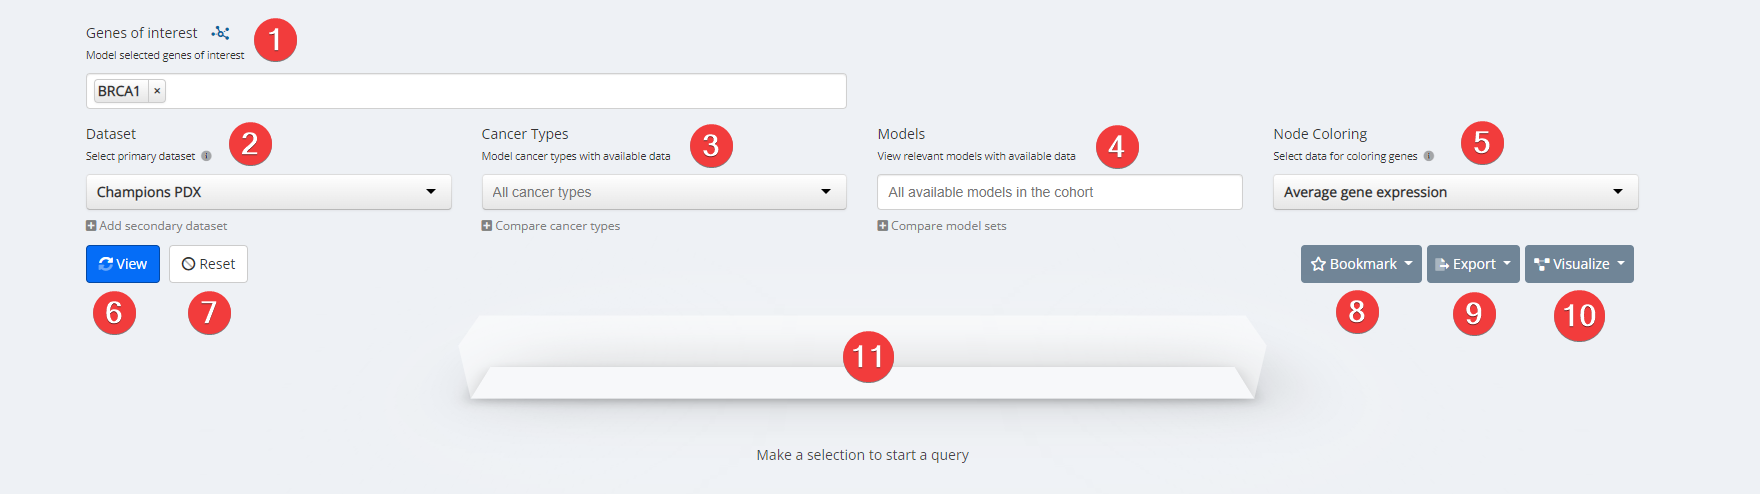
Networks Inputs
- Gene Input. Select your genes or proteins of interest. Only options with available data for your other selections will be clickable. Options that are greyed out have no available data for your other selections.
- Dataset. Choose from the dropdown menu between Champions Database, Online Database such as CPTAC, or your own data previously uploaded to Lumin. Options that are greyed out are not available for visualization.
- Cancer Type. Select cancer type of interest from the dropdown menu or leave blank for cancer types. Please Note: A specific cancer type is required for all datasets other than Champions PDX, and for the Protein Abundance node coloring option.
- Model/Sample Input. Select specific models with available data or leave blank for all available models with data.
- Node Coloring Input. Select data for coloring genes. Changes to node color can be made without clicking the View button, but if any other parameter changes (including Signature or Signature Variable) you must click View to refresh the network. Gene Signature Correlation in the tooltip will read "Not Set" until the network is colored by Gene Signature, all fields have a selection, and View is clicked.
- View.
- Reset. Reset all query boxes back to the default.
- Bookmark. Save an analysis or load from an existing analysis. Please Note: As we are continually updating our data the visualization may change slightly from the time it was first analyzed. Users can also manage all bookmarks under "My Bookmarks" in Account Settings at the top right of any Lumin page.
- Export. Analysis can be exported as a CSV file, PNG image or into Lumin Workspaces.
- Visualize. Data inputs can be populated and visualized in Clustering Heatmap, Target and Biomarker Discovery, Oncoprint, Mutation Mapper, and High/Low expression.
- Loading Task Bar. Building your requested visualization may take some time. The status of your request will be displayed here.
Network Visualization
Network for BRCA1 in the Champions PDX dataset with all cancer types and models visualized, colored by average gene expression.

Networks Visualization
- Legend. Showing average Z-score and Phosphorylation Intensity. You can also remove interactions and search for a gene.
- Tooltip. Gives available values for gene expression, mutation count, signature p-value, kinase activity and protein intensity. Right click and click 'Details' for more information on a gene.
- Gene of Interest Node. Central nodes are the genes which have been entered into the 'Genes of Interest' input.
- Interaction Edge Shows directionality of each interaction by hovering over the line. Each line is colored based on the interaction type. To view/remove interaction types click 'Remove Interactions' in the legend.
- Secondary Nodes. Shows phosphorylation events detected. Median Phosphorylation Intensity is shown in the legend. Hover over each node to get the median phosphorylation intensity for each event.
Available Data
Champions PDX
Champions Cell Lines
CPTAC
Mutation Count
Gene Signature
Your Data
Key Terms
Common Analysis with Gene Network
Confirm an Interaction/Identify a New Interaction for a Pathway of Interest
- Click the pathways icon after 'Genes of interest'
- Find your pathway of interest and click 'Select genes'
- Select your desired dataset.
- Select a specific cancer type, if desired. A specific cancer type is required for all datasets other than Champions PDX.
- Select data for coloring genes from Node Coloring dropdown menu.
- Click 'View'
View/Confirm Phosphorylation Activity in Primary Samples in Public Dataset (CPTAC)
- Input your genes or proteins of interest in the 'Genes of interest' text bar.
- Select 'CPTAC' dataset.
- Select a specific cancer type if desired.
- Select data for coloring genes from Node Coloring dropdown menu.
- Click 'View'
References and Acknowledgements
Gene Network is based on the Pathway Commons Database. Pathwaycommons.org. 2022. Pathway Commons: A Resource for Biological Pathway Analysis. [online] Available at: https://www.pathwaycommons.org/
Updated over 2 years ago