Target & Biomarker Discovery
Find differentially expressed genes across model cohorts.
General Description
Our Target & Biomarker Discovery tool aims to help users perform gene expression analysis, quantify mutational occurrences, pathway analysis or perform spearman/pearson correlations using Champions PDX or datasets run external to Champions. You can leverage existing in vivo %TGI for SOC agents to develop biomarker hypotheses. Users can upload their pharmacological drug study data (IC50 or TGI values) or subset models into group A versus group B. Users can compare datasets to identify differentially expressed genes or genes positively or negatively correlated with response.
Target & Biomarker Discovery Input
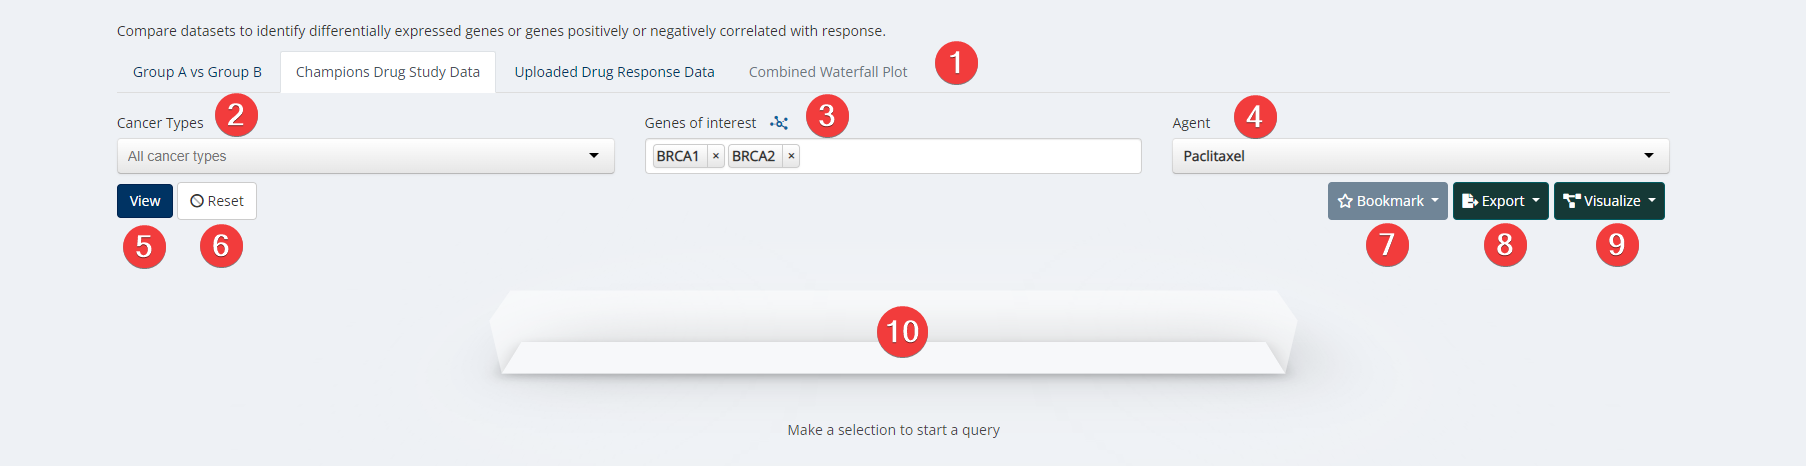
Target & Biomarker Discovery Input
- Analysis Type.
- Cancer Type. Select cancer type of interest from the dropdown menu or leave blank for all cancer types.
- Genes of Interest. Select your genes or proteins of interest. Only options with available data for your other selections will be clickable. Options that are greyed out have no available data for your other selections.
- Agents. Select an agent of interest from the dropdown menu or leave blank for all agents. Please Note: You must select either a cancer type or agent to run the analysis.
- View.
- Reset. Reset all query boxes back to the default.
- Bookmark. Save an analysis or load from an existing analysis. Please Note: As we are continually updating our data the visualization may change slightly from the time it was first analyzed. Users can also manage all bookmarks under "My Bookmarks" in Account Settings at the top right of any Lumin page.
- Export. Analysis can be exported as a CSV file, PNG image or into Lumin Workspaces.
- Visualize. Data inputs can be populated and visualized in Clustering Heatmap, TGI Heatmap, Oncoprint, Mutation Mapper, and High/Low Expression.
- Loading Task Bar. Building your requested visualization may take some time. The status of your request will be displayed here.
Target & Biomarker Discovery Visualization

Target & Biomarker Discovery Visualization
- Waterfall Plot. The y-axis displays TGI (%), Group A represents models that are sensitive to treatment (dark blue bars) and Group B represents models resistant to treatment (green bars). Click and hold to grab the dashed lines in the waterfall plot and move them up and down to select sensitive and resistant model groups.
- Genes of Interest. The genes here correspond to the genes entered in Step 3 above. The legend indicates what each color block represents.
- Method. Select an analysis method to perform from the dropdown menu. Choose between Differential Gene Expression, Fisher's Exact Test for Mutation Occurrence, Spearman Correlation (Gene Expression) or Pearson Correlation (Gene Expression).
- Data Type. Choose between Champions PDX Data or your uploaded data. For data you have uploaded:
- a) Differential Gene Expression corresponds to your uploaded counts data.
- b) Correlation analysis corresponds to uploaded expression data (RPKM).
- Max P-Value. From the dropdown select your maximum P-Value within the range of 0.01-1. This is a priori p-value selection: return results less than or equal what you choose.
- Run Analysis. Click here to run your analysis. The analysis is run in real time and therefore may take some time.
Differential Gene Expression (DGE)

- Download. Export the list of genes as a CSV file.
- P-Value Toggle. Use the slider to further bound the adjusted p-value range of genes displayed in the table, the max will not exceed the value selected above in Step 5.
- Results Tabs. Choose from the following:
- a) Genes - Shows the Differential Gene Expression (DGE) with values for log Fold Change and Adjusted P Value for each gene.
- b) Pathways - Genes deemed sufficiently significant (from the Genes tab, after p-value filtering using the
dropdown and slider) are used to rank transcription pathways. The assigned score is the percentage of genes in the pathway that are present in the Genes tab. Please Note: Wait times vary, and may go up to 10 minutes. - c) Gene Set Enrichment - This lists the ranked Broad Institute/UCSD GSEA pathways computed using the same Benjamini & Hochberg (1995) p-value adjustment.
- View in Heatmap. Select individual genes by checking the box, and click the Heatmap button to view expression data for those genes.
Differential Gene Expression (DGE) Analysis is done using the computation and ranking algorithms in edgeR with the default Benjamini & Hochberg (1995) p-value adjustment to correct the false discovery rate for multiple comparisons. The full analysis consists of fitting a linear model for each gene to the selected models in each group and then computing moderated t-statistics, moderated F-statistic, and log-odds of differential expression by empirical Bayes moderation of the standard errors towards a global value. The moderated t-statistics test each individual contrast is equal to zero, the moderated F-statistic tests whether all the contrasts are zero, and the log-odds of differential expression (B-statistic) can be used to infer whether the gene is differentially expressed. The log2-fold-change estimate is also reported for each contrast.
Correlation: Pearson's and Spearman's Methods
Spearman's and Pearson's correlation analyses compute the correlation between gene expression and TGI for a selected model group. Select a model group using one or both of the horizontal dashed lines on the waterfall plot. Unlike the DGE and Fisher's analyses, the correlation analyses combine Groups A and B into a single group for analysis. Alternatively you may slide one threshold line beyond the bars and only use the other one to highlight a selected group. Which line you use depends on whether you are looking for correlations with the high response group (Group A when viewing TGI) or the low response group (Group B when viewing TGI in the waterfall).
Pearson's product-moment correlation computes a correlation coefficient (cor) between the TGI and expression, while Spearman's Rank-Order correlation computes the rho value. The Pearson method assumes the data are ratio or interval data and that the errors are normally distributed around the trendline, while the Spearman method assumes the data are ordinal and the errors are nonparametric. Both methods assume a monotonic relationship in the data.
Mutation Occurrence: Fisher's Exact Test
The Fisher's Exact test in Lumin creates a 2x2 contingency table for each gene+sample combination, filling the table with mutation count and wild-type count for each group. The test uses the null hypothesis that mutations for the gene are evenly distributed among samples. The output contains the gene symbol, a p-value indicating whether the null hypothesis can be rejected for that gene (and by extension whether we can be confident that the proportion of mutations in the two groups is different for some non-random reason), and the mutation counts in group A and group B. This test is useful for evaluating whether the occurance of mutations in both small and large sample groups is random or the product of a shared factor.
In Lumin this test is performed in R using the stats::fisher.test() function.
CNA Thresholds
| Alteration | Copy Number |
|---|---|
| Deep Deletion (HomDel) | 0 |
| Shallow Deletion (HetLoss) | 1 |
| Low Level Gain (Gain) | 3 |
| High Level Amplification (Amp) | > =4 |
Available Data
Champions PDX Data
Your Data
Key Terms
RPKM - RPKM values are a normalized measure of how abundantly expressed a specific gene is. RPKM stands for Reads Per Kilobase Million and is calculated from the number of reads (sequenced fragments) that align to a reference human genome (see above). These absolute read counts need to be corrected for gene length (the “Per Kilobase” part of RPKM) and sample sequencing depth (the “Million” part of RPKM) because these two elements can artificially skew higher the absolute reads for some genes. Long genes will naturally have more reads aligning to them because they have more fragments that can be sequenced. Samples with greater sequencing depth will have more reads aligning to them because more of the fragmented mRNA (cDNA) is actually sequenced.
CNA - Copy Number Alteration.
Gene Set Enrichment Tab:
Enrichment Score - The sign indicates whether gene set enrichment is higher or lower in comparison to the control group.
Adjusted P Value - Benjamin & Hochberg Adjusted P value.
Size - Count of genes in the set.
Leading Edge - Subset of genes that account for the set's enrichment signal.
Common Analysis with Target & Biomarker Discovery
Develop a New Biomarker Hypothesis
References and Acknowledgements
Benjamini, Y., and Hochberg, Y. (1995). Controlling the false discovery rate: a practical and powerful approach to multiple testing. Journal of the Royal Statistical Society Series B, 57, 289–300. doi: 10.1111/j.2517-6161.1995.tb02031.x. https://www.jstor.org/stable/2346101.
Updated over 2 years ago