Molecular Graphing
Explore Molecular Data
General Description
Our Molecular Graphing Tool aims to plot expression across samples by cancer type.
Molecular Graphing Input
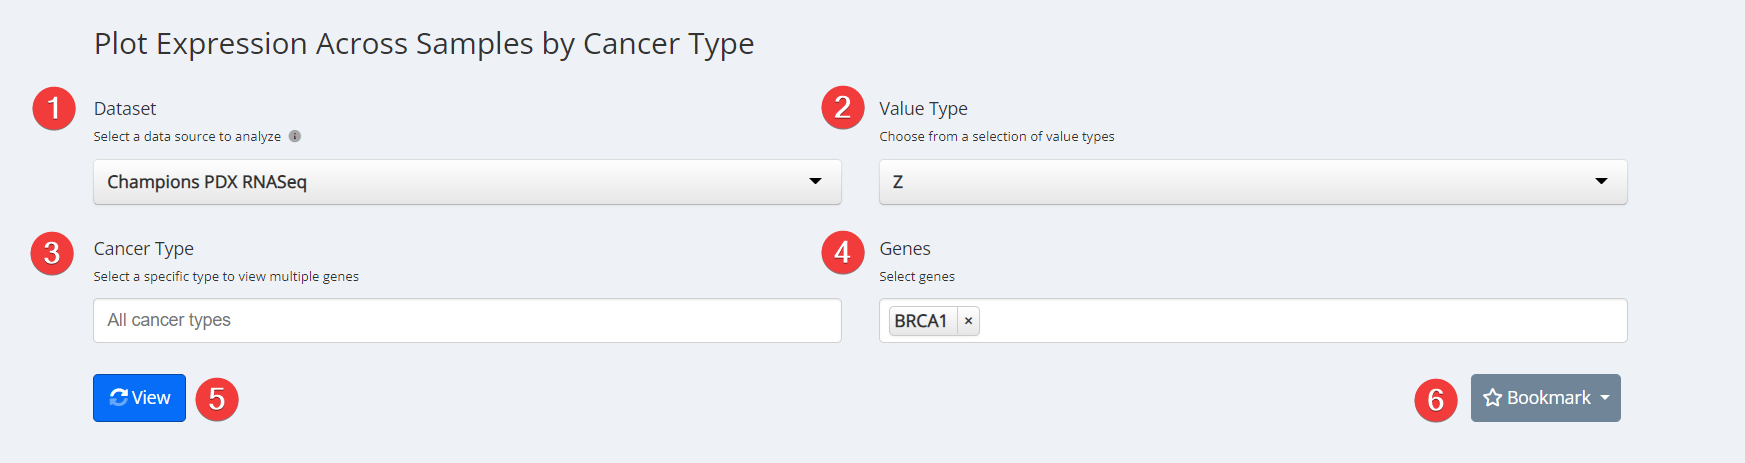
Molecular Graphing Input
- Dataset. Choose from the dropdown menu between between Champions PDX RNASeq, PDX Proteomics, Cell Lines or Public data.
- Value Type. Choose between Z-Score or TPM values.
- Cancer Type. Select cancer type of interest from the dropdown menu or leave blank for cancer types.
- Genes. Select your genes of interest. Only options with available data for your other selections will be clickable. Options that are greyed out have no available data for your other selections. Please Note: You must choose at least one gene in order to run visualization.
- View.
- Bookmark. Save an analysis or load from an existing analysis. Please Note: As we are continually updating our data the visualization may change slightly from the time it was first analyzed. Users can also manage all bookmarks under "My Bookmarks" in Account Settings at the top right of any Lumin page.
Molecular Graphing Visualization

Molecular Graphing Visualization
Available Data
Champions PDX RNASeq
Champions PDX Proteomics
Champions Cell Lines
Key Terms
TPM - Transcripts Per Million (TPM) is a normalization method for RNA-seq. You can interpret this as "for every 1,000,000 RNA molecules in the RNA-Seq sample, x came from this gene/transcript."
Z-Score - Z-Scores are calculated by subtracting the overall average gene abundance from the raw expression for each gene, and dividing that result by the standard deviation (SD) of all of the measured counts across all samples.
Common Analysis with Molecular Graphing
Coming Soon!
References and Acknowledgements
Plots produced by Plotly. The front end for ML and data science models. Plotly. (n.d.). Retrieved 2022, from https://plotly.com/
Updated over 2 years ago