Global Clustering
Explore datasets with unsupervised machine learning.
General Description
Our Global Clustering tool aims to help users vizualize Champions PDX models in a T-SNE and overlay gene expression or agent response data. Your in-house RNASeq data can be uploaded and aligned in a T-SNE or overlaid in a UMAP with TCGA or Champions PDX model data.
Global Clustering Input
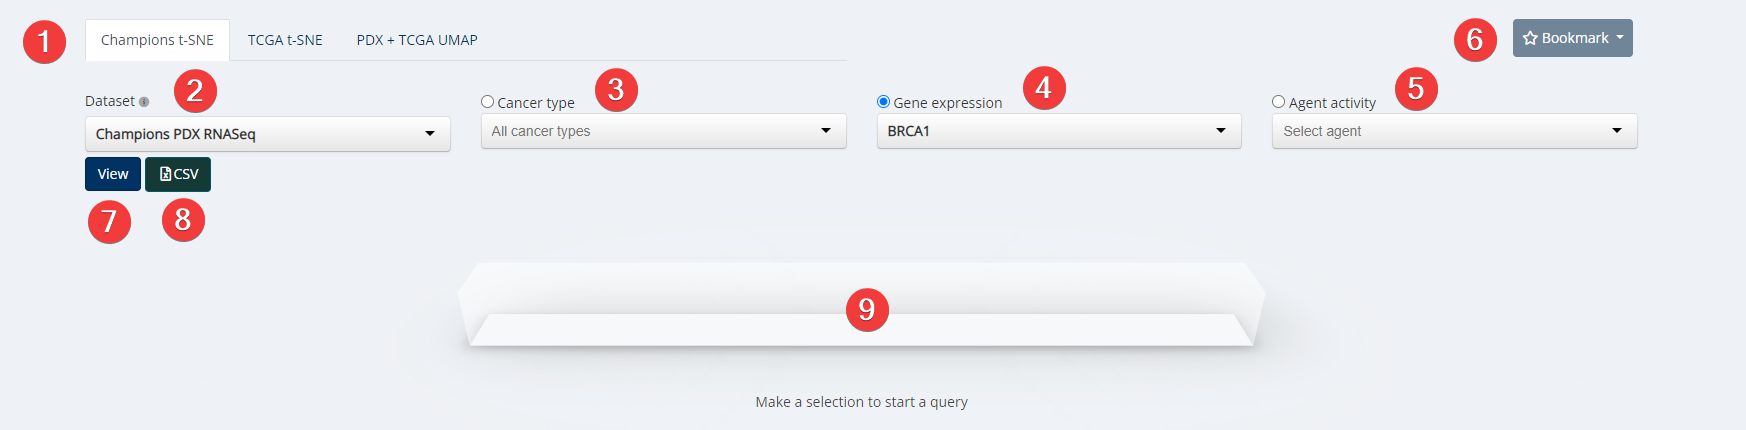
Global Clustering Inputs
- Analysis. Choose between Champions t-SNE, TCGA t-SNE or PDX TCGA + UMAP.
- Dataset. Choose from the dropdown menu between Champions PDX, Champions Cell Lines Data or TCGA.
- Cancer Type. Select cancer type of interest from the dropdown menu or leave blank for all cancer types. Please Note: A specific cancer type is required for all datasets other than Champions PDX.
- Gene Expression. Select your genes of interest. Only options with available data for your other selections will be clickable. Options that are greyed out have no available data for your other selections.
- Agent Activity. Select specific test agents with available data or leave blank for all available test agents with data.
- Bookmark. Save an analysis or load from an existing analysis. Please Note: As we are continually updating our data the visualization may change slightly from the time it was first analyzed. Users can also manage all bookmarks under "My Bookmarks" in Account Settings at the top right of any Lumin page.
- View.
- CSV. After clicking 'View' you can also download the results as a CSV file by clicking this button.
- Loading Task Bar. Building your requested visualization may take some time. The status of your request will be displayed here.
Global Clustering Visualization

Global Clustering Visualization
This plot shows the similarity between the Champions PDX samples for visual analytics, where the similarity for each point is visualized as proximity of the points. Sample points that are ‘similar’ are placed close to each other.
Available Data
Champions PDX
Champions Cell Lines
TCGA
Key Terms
t-SNE - T-distributed Stochastic Neighbor Embedding
UMAP - Uniform Manifold Approximation and Projection
Common Analysis with Global Clustering
Coming Soon!
References and Acknowledgements
Plots produced by Plotly. The front end for ML and data science models. Plotly. (n.d.). Retrieved 2022, from https://plotly.com/
Updated over 2 years ago